
Implied vs Actual Earnings Moves: Is the Market Overpricing Volatility?
Implied vs Actual Earnings Move: Why This Gap Matters
Every earnings season, options traders run into the same question. A stock is about to report, the options are pricing in a big move, and the trader has to decide whether that move is realistic or whether the market is simply charging a premium for uncertainty. This is the implied vs actual earnings move gap; the difference between what the options market implies and what the stock actually does after the print, and it is one of the most useful edges in options trading, measurable before you ever place a trade.
"The gap between what the options market implies and what the stock actually does after the print is one of the most useful edges in options trading, and it is measurable before you ever place a trade."
This comes down to two numbers: the implied move and the actual move. Understanding both, and how often one overstates the other, changes how you approach every earnings trade you place.
What Is the Implied Move?
The implied move is what the options market is pricing in before the earnings report comes out. It represents the market's consensus bet on how far a stock will travel, in either direction, once the news is out.
You pull it from the at-the-money straddle in the weekly expiration closest to the earnings date. The math is simple:
Straddle Price ÷ Stock Price = Implied Move %
Since a straddle combines a call and a put at the same strike, it does not care which direction the stock moves. It only measures how large a move the market expects. The more expensive that straddle is relative to the stock price, the bigger the move the market is pricing in.
What Is the Actual Move?
The actual move is simply what the stock does after the announcement. Once earnings are out, you compare the stock's new price to where it closed before the report, and that percentage change is the actual move. The question every trader eventually asks is whether the actual move typically comes in above or below what the options market implied.
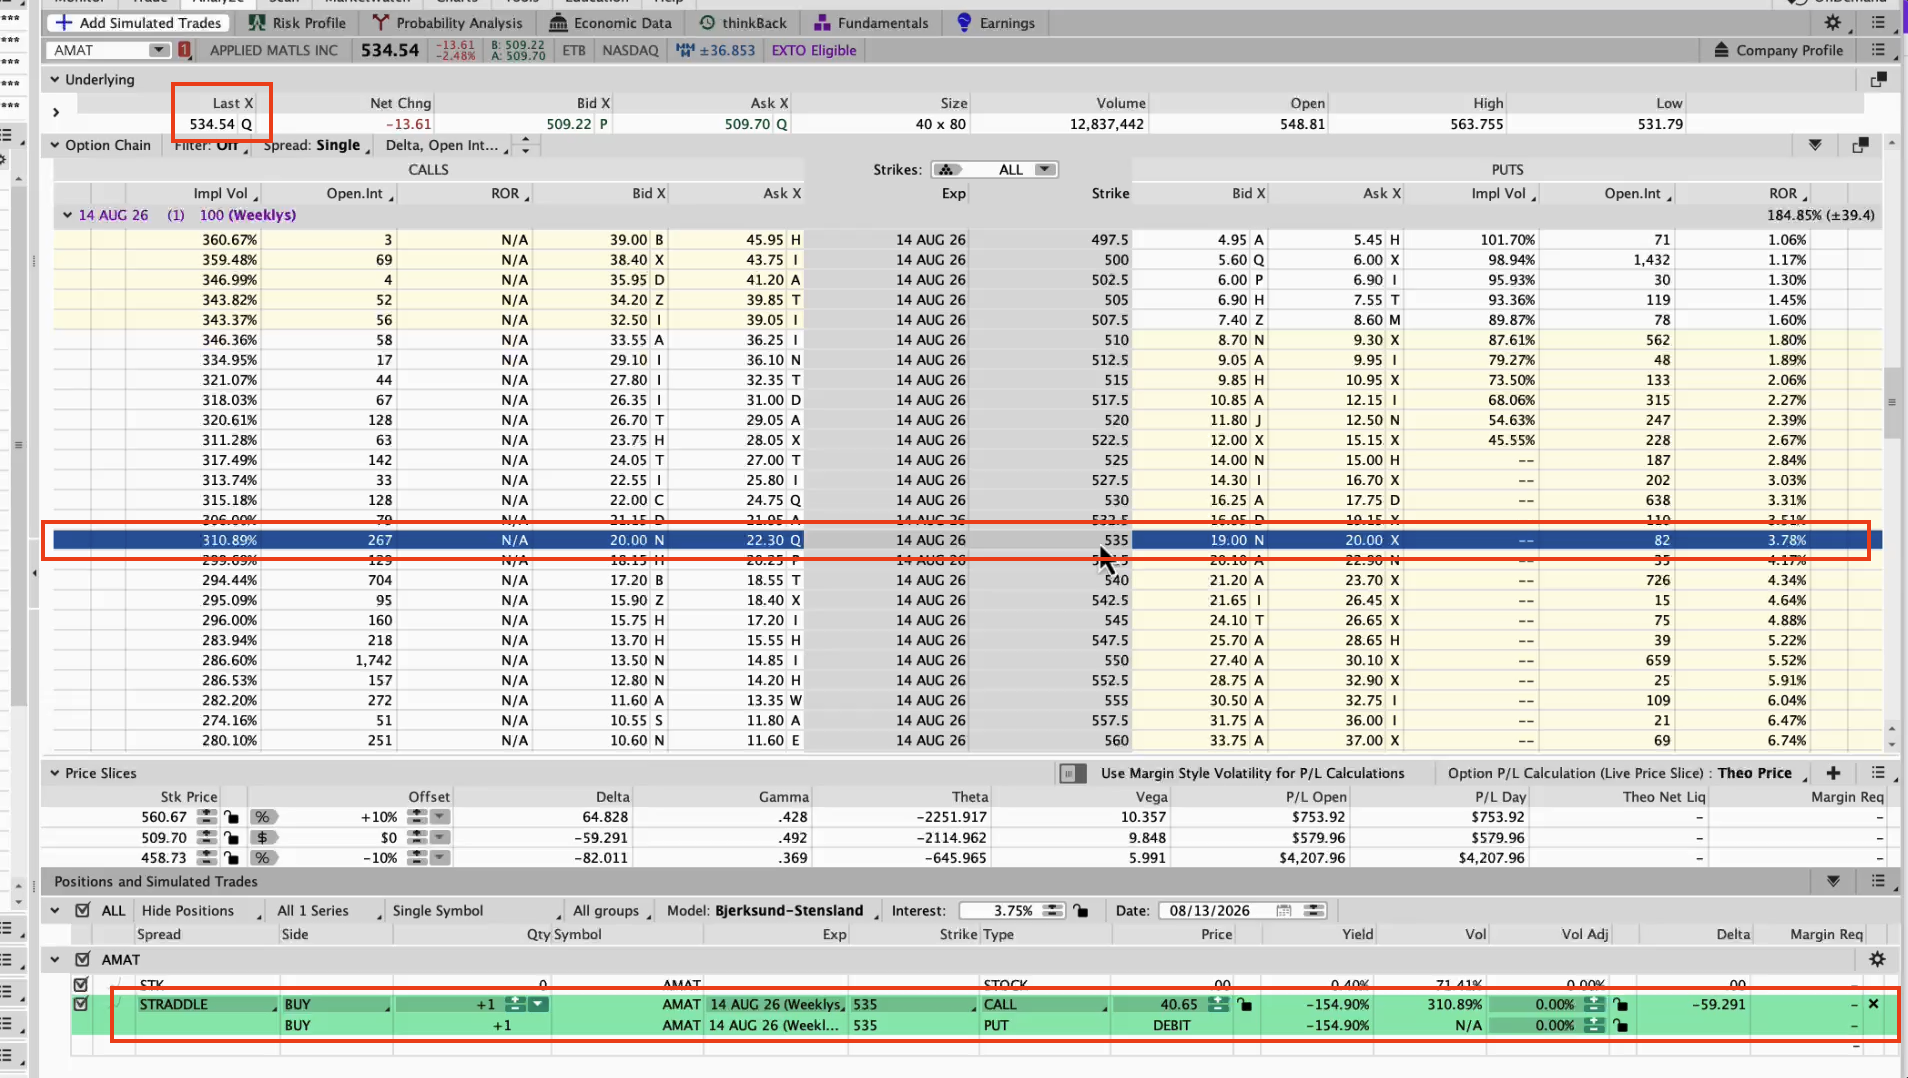
ATM options straddle setup just before earnings announcement.
A Real Example, Step by Step
Here is how this plays out with a live example. A stock closed at $534.54 heading into its earnings report, and the company beat expectations, posting earnings per share of $3.50 against an estimate of $3.38.
Before the announcement, the at-the-money straddle at the 535 strike, in the nearest weekly expiration, was priced at $40.65 combined between the call and the put. Dividing that by the $534.54 stock price gives an implied move of about 7.6%.
After the report, the stock gapped down roughly $25 in after-hours trading, landing near $509. That works out to an actual move of about 4.7%.
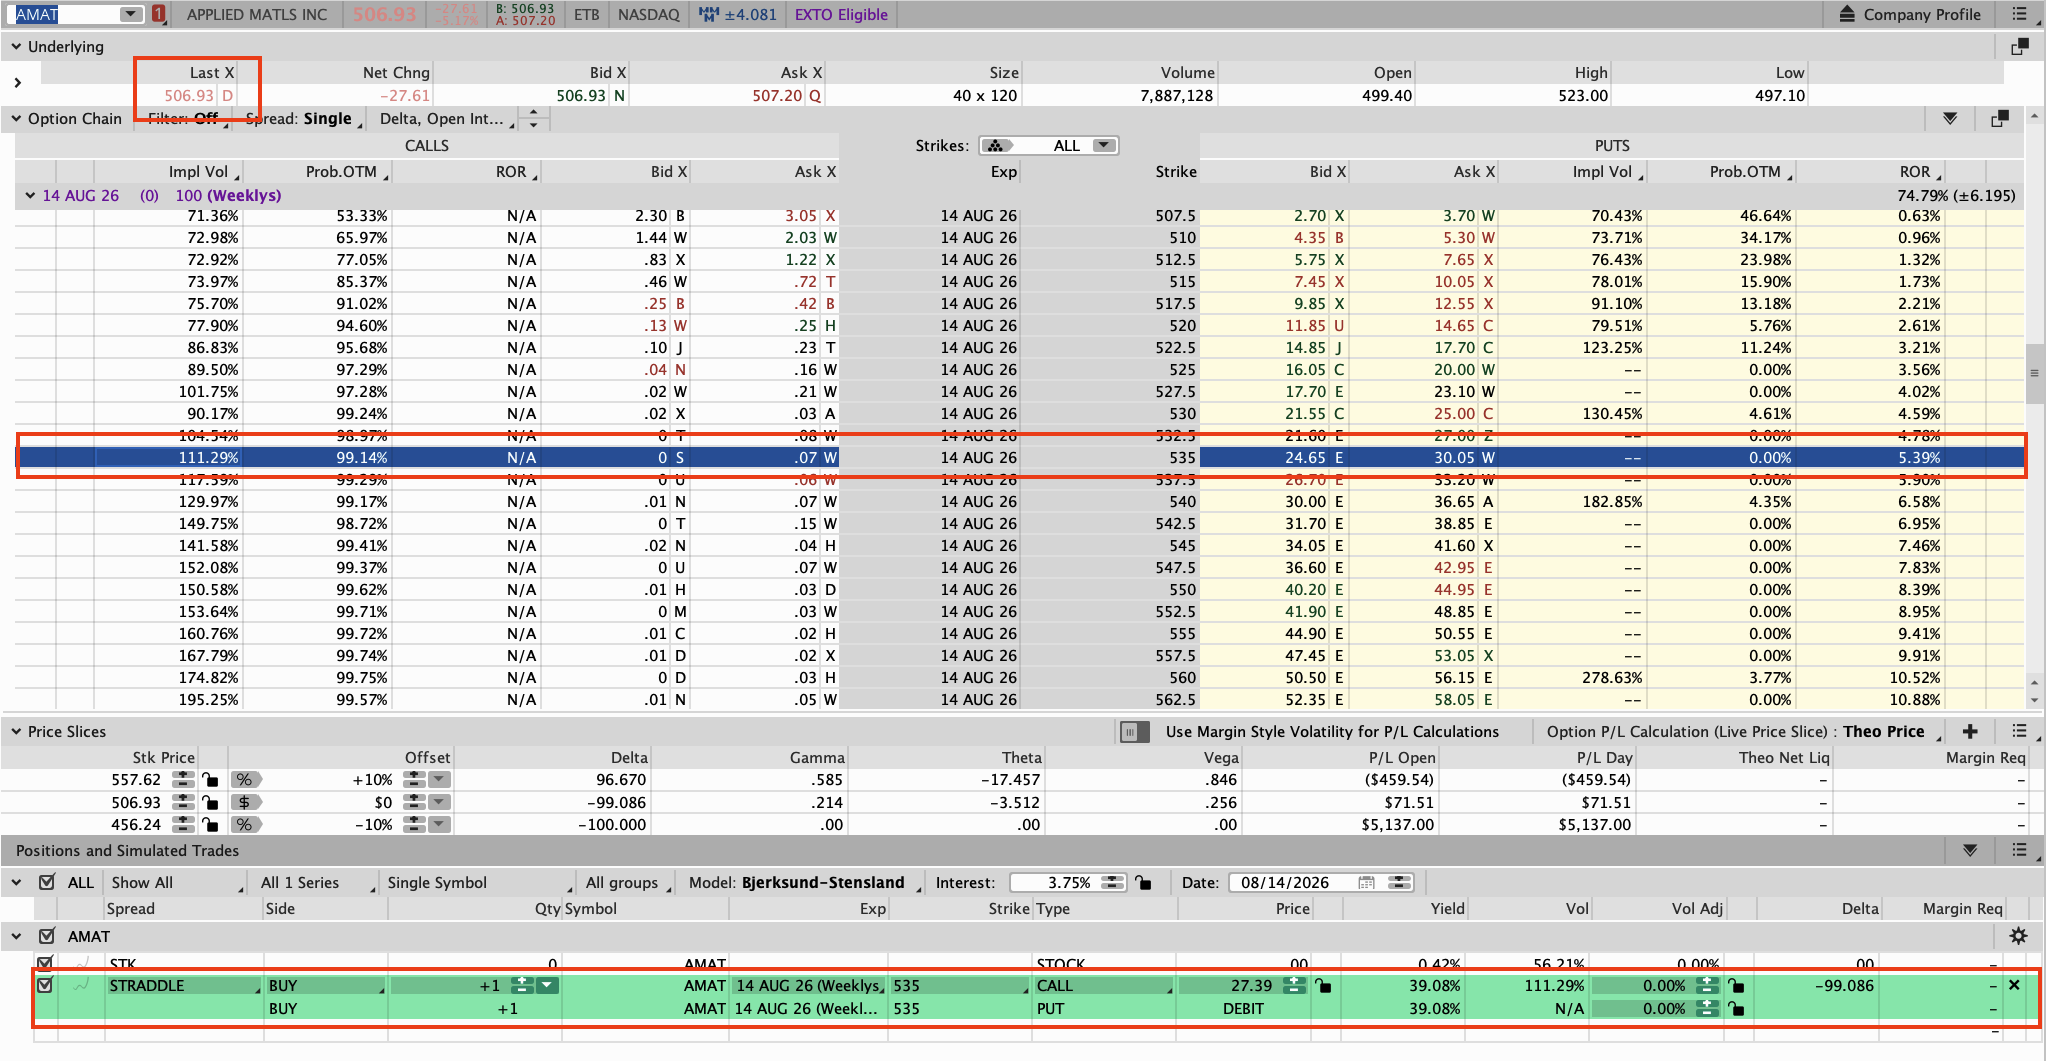
ATM options straddle setup just after earnings announcement.
In this case, the options market priced in a move nearly 3 percentage points larger than what actually happened. The straddle buyers overpaid for protection they did not need, and the person who sold that straddle had the statistical wind at their back. That gap between implied and actual is not a one-off. It shows up often enough that it is worth understanding why.
"The straddle buyers overpaid for protection they did not need, and the person who sold that straddle had the statistical wind at their back."
The Gap Shows Up More Than You Would Think
This is a widely cited pattern in options research, not a forecast for any single stock or earnings date. Historically, stocks have stayed inside their options implied move somewhere in the range of 70% to 75% of the time. A theoretical one standard deviation containment rate is 68%, and realized containment tends to run a bit higher than that in practice.
That gap between the theoretical 68% and the higher realized number is the signal. Implied volatility tends to run rich heading into earnings, which means options sellers have had the statistical edge more often than not historically. It does not mean every trade works out, and it is not a guarantee for any individual name. Always check a ticker's own IV rank and earnings history before trading it.
"That gap between the theoretical 68% and the higher realized number is the signal."
Why Implied Moves Run Hot
There are a few structural reasons the market tends to pay up for uncertainty, even when the stock does not deliver the drama.
Volatility Risk Premium
Sellers of options demand compensation for taking on event risk, so implied volatility tends to sit above what realized volatility usually turns out to be.
Hedging Demand
Funds and money managers buy protection into earnings regardless of which direction they expect the stock to move. That buying pressure pushes option prices, and implied volatility moves higher.
Fear of the Tail
One outsized surprise sticks in memory a lot longer than dozens of quiet quarters. The market ends up pricing every report as if the tail event might repeat.
Market Maker Cushion
Dealers widen implied volatility to protect their own book against gap risk, building in a buffer that rarely gets fully used.
Watching for the Volatility Crush
Implied volatility does not just affect the size of the expected move; it also affects what happens to option premiums right after the report. In the example above, implied volatility was sitting around 71% heading into earnings, well above its lower range for the past year. Once the news was out, that volatility was expected to crush down significantly, which is exactly what tends to happen once the uncertainty behind an earnings report is resolved. That volatility crush works against anyone holding long options into the report and in favor of anyone who sold premium.
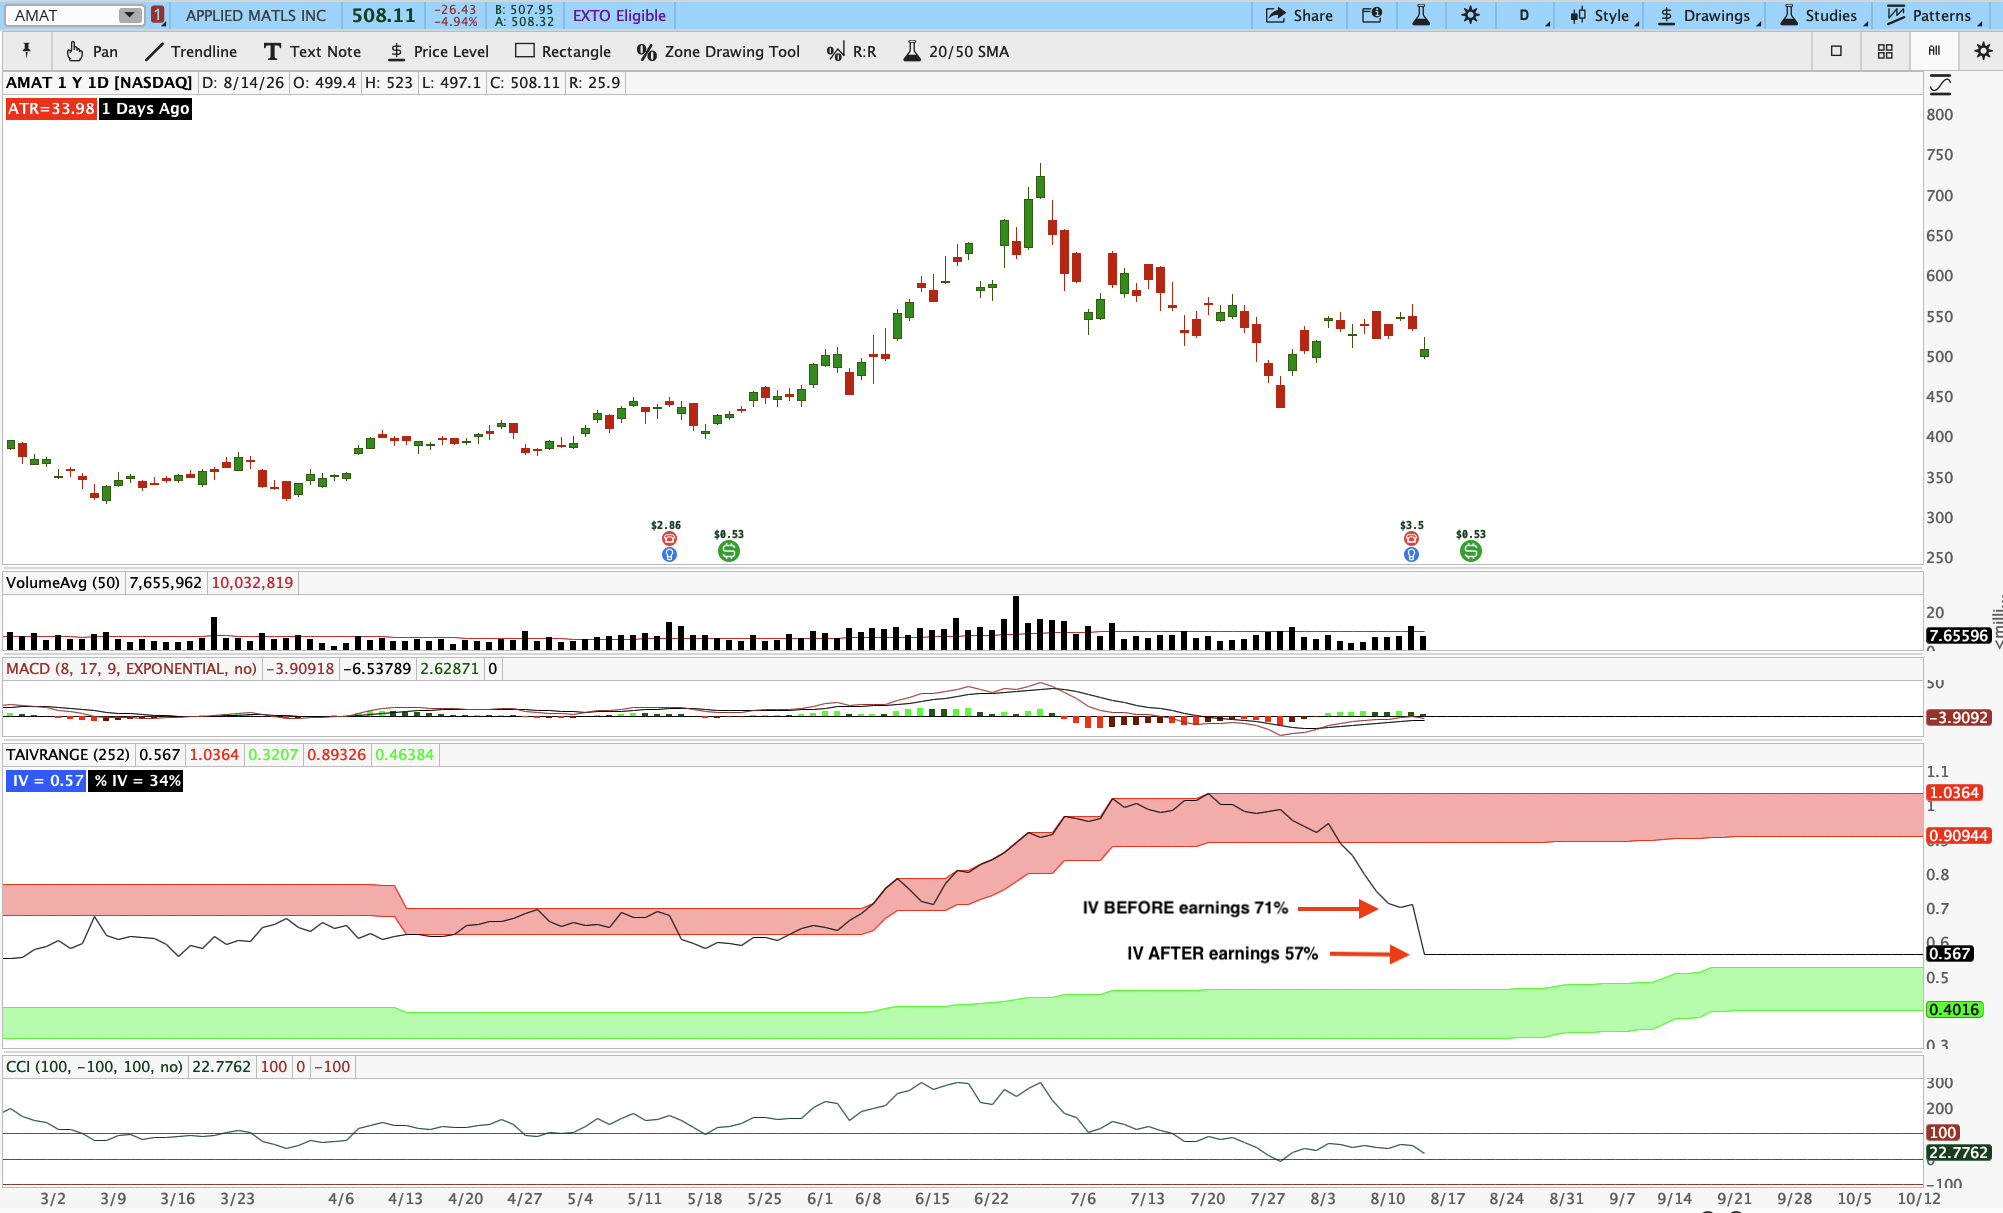
Implied Volatility was trading at 71% before earnings, and 57% the next morning.
Putting the Edge to Work
Knowing the pattern is one thing. Using it in a repeatable way is another. Here is a simple framework for checking whether a stock's implied move looks rich before you place a trade.
Pull the implied move. Check the at-the-money straddle in the nearest weekly expiration before the report.
Compare it to history. Line the implied move up against the stock's actual moves from the last eight to twelve quarters.
Check IV rank. A high IV rank going into earnings often means the premium is elevated relative to the stock's own history, not just because of the event itself.
Size the trade. If the edge holds up, defined risk structures like iron condors, put credit spreads, or butterflies get paid to sell that gap. Naked straddles and strangles carry open-ended risk if the stock happens to be one of the moves that exceeds the implied range, so size for the loss, not just the win.
The Takeaway
Implied volatility exists to compensate options sellers for taking on event risk, and historically that compensation has run a bit rich more often than not. That is not a green light to sell every straddle into every earnings report. It is a reminder to measure the implied move before you trade it, compare it against the stock's own history, and use position sizing and defined risk structures instead of assuming the pattern will hold on any single name.
Options involve risk and are not suitable for every investor. This article is for educational purposes only and is not a recommendation to buy or sell any security. Past patterns do not guarantee future results.