
Market Breadth Explained: How Professional Traders Use It to Read the Market
The S&P 500 closes up half a percent. The headlines call it a good day. But your portfolio is flat, or worse, and you're left wondering what you're missing. Most of the time, what you're missing is breadth.
Market breadth explained simply: it's the measure of how many stocks are actually participating in a move, not just where the index landed. An index can climb while the majority of stocks underneath it go nowhere or fall outright, because a handful of mega-cap names are doing the heavy lifting. Professional traders don't take the headline number at face value. They check breadth first, because breadth tells you whether a rally has real support or whether it's being carried on the shoulders of a few large names that could roll over at any time.
This is one of the biggest gaps between retail and professional trading. Retail traders watch the index. Professionals watch what's happening underneath it. Once you learn to read breadth, you stop getting surprised by reversals that "came out of nowhere," because most of the time they didn't come out of nowhere at all. The warning signs were sitting in the breadth data days or weeks before price caught up.
Market Breadth Explained: What It Actually Measures
Market breadth gives traders a deeper view of overall market health by measuring how many stocks are participating in a move, rather than just looking at where the index closed. It can reveal whether a rally or a selloff is broad-based and sustainable, or whether it's being driven by just a handful of large-cap names while everything else quietly deteriorates.
This matters because price and participation don't always move together. An index can rise while most individual stocks are declining, and that gap is exactly what breadth exposes. A headline number can look strong even while the market underneath it is losing strength, and that hidden weakness usually shows up in breadth data well before it shows up in price.
Breadth indicators track advancing stocks against declining stocks, giving traders a true pulse on the health of the broader market. Professionals use this data to confirm trends, spot early warning signs, and avoid getting misled by index-level price action that doesn't tell the whole story.
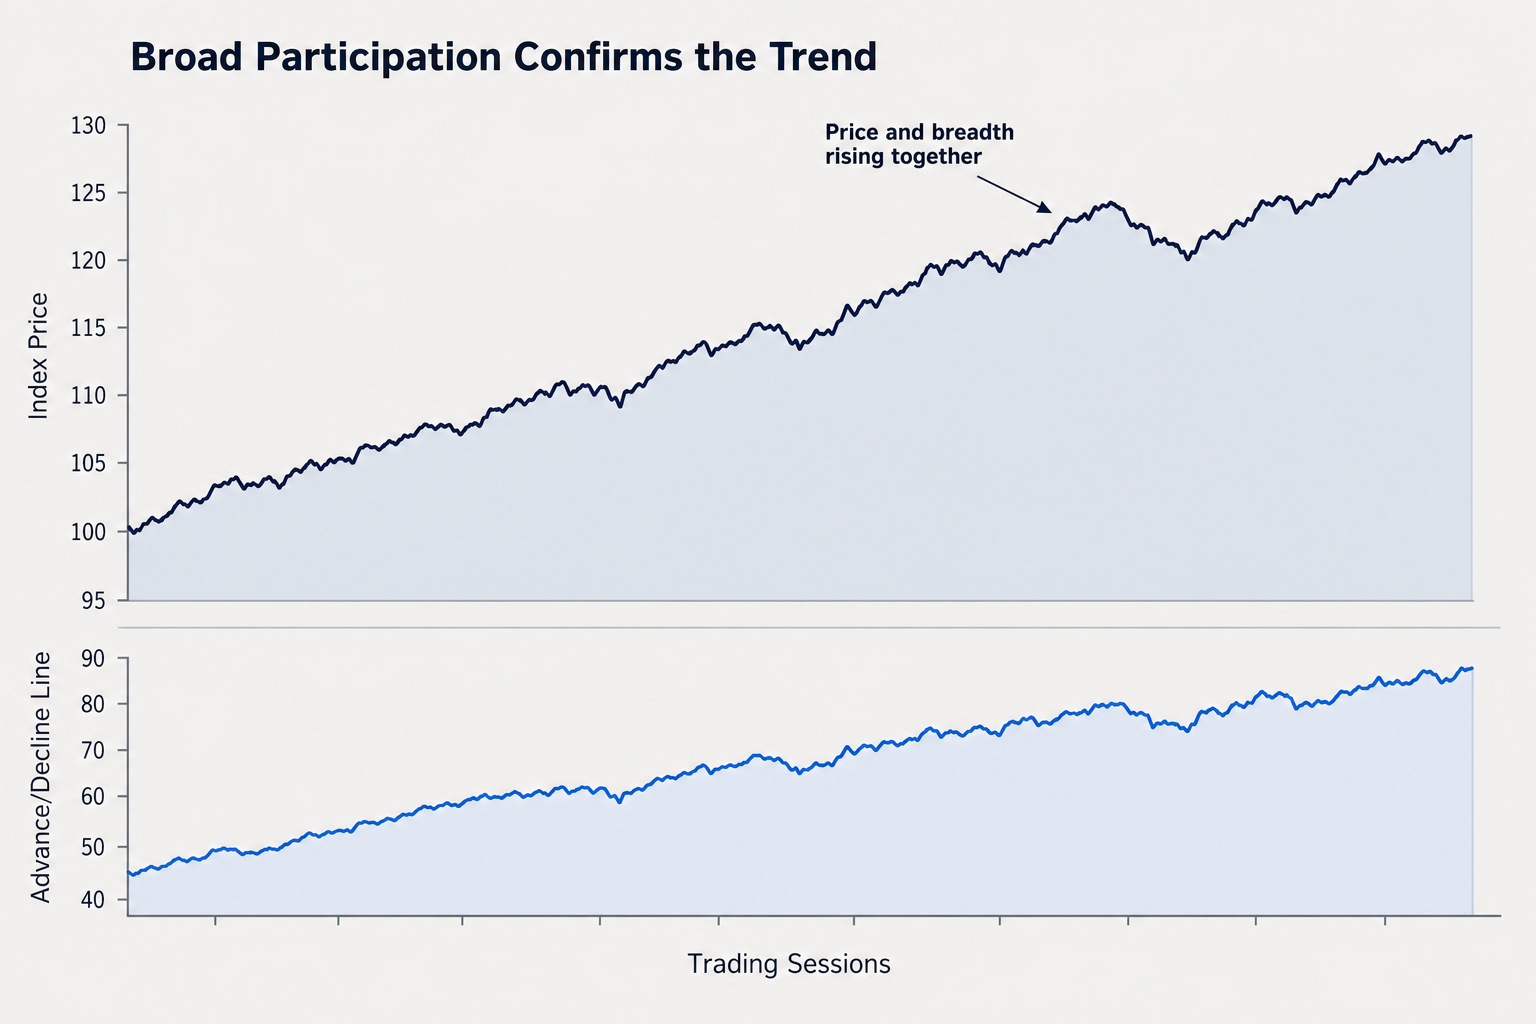
When price and the advance/decline line rise together, participation is broad, and the trend has real support.
The Three Core Breadth Indicators
Professional traders lean on a handful of core tools to assess the true health and direction of the broader market. Three show up in almost every serious trader's routine.
The Advance/Decline Line
Tracks the cumulative difference between advancing and declining stocks over time. When the A/D line is climbing alongside the index, participation is broad and the trend has real support underneath it. When the two start to pull apart, that's your first clue that something is off.
New Highs vs. New Lows
Compares the number of stocks hitting fresh 52-week highs against those hitting fresh 52-week lows. This ratio is one of the cleanest ways to gauge momentum strength and spot potential turning points before they show up in the major indexes.
Percentage of Stocks Above Moving Averages
Measures what share of the market is trading above key moving averages, typically the 50-day or 200-day. A high reading signals broad strength across the market. A low or falling reading, even during a rising index, signals deterioration that a lot of traders miss because they're only watching price. This is also where sector context matters. Two rallies can look identical on an index chart and be completely different underneath, and that's exactly the distinction our team breaks down in Why Sector Thinking Beats Stock Picking.
How Pros Use Breadth in Practice
Knowing the indicators is one thing. Using them well is another. Here are the four applications professional traders rely on most.
Confirming Trend Strength
When price moves higher alongside broad participation across sectors and individual stocks, that trend is considered healthy and more likely to hold. A move built on a handful of names is a different story, and it's a much more fragile one.
Spotting Divergences Early
If price makes a new high but breadth is weakening underneath it, that's a divergence, and it's one of the more reliable warning signs available to traders. Breadth tends to roll over before price does, which gives disciplined traders a head start on the crowd.
“Breadth tends to roll over before price does, which gives disciplined traders a head start on the crowd.”
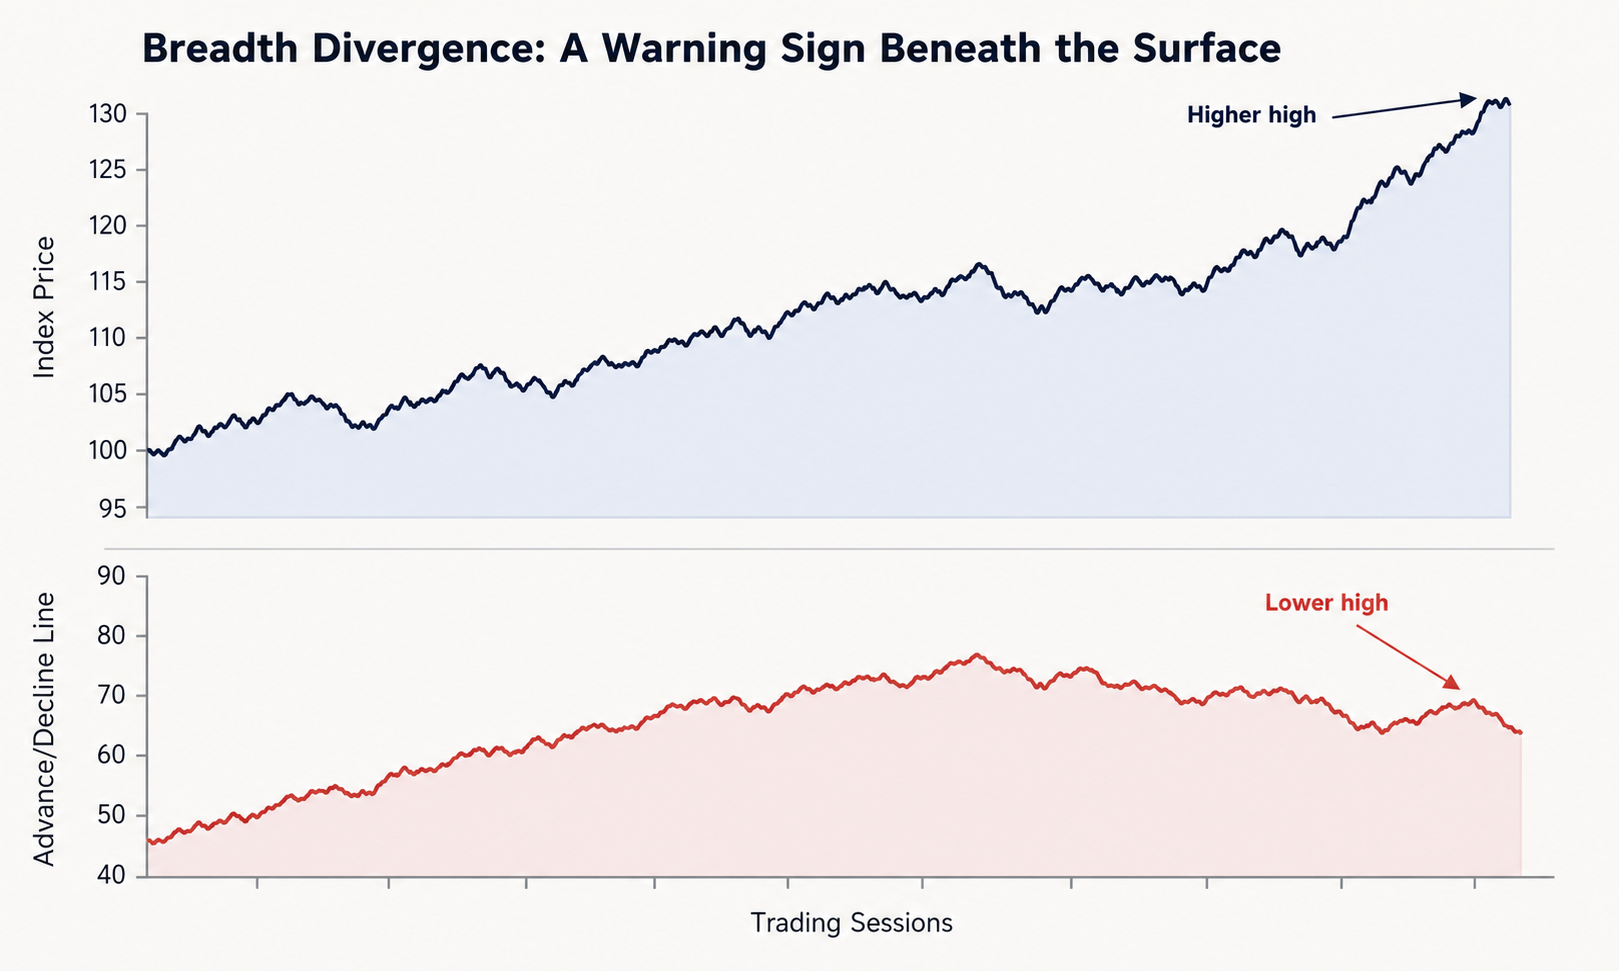
A price high paired with a weaker breadth reading is a classic divergence, and it often shows up before the reversal does.
Timing Entries and Exits
Breadth thrusts, sudden surges in the percentage of advancing stocks, and breadth washouts, extreme readings on the downside, help traders pinpoint higher-probability entry and exit windows. This kind of timing discipline improves precision and cuts down on exposure to poorly timed trades. It also ties directly into how much size a trader is willing to put on any single position, which is really a question of Capital Allocation as much as it is about market timing.
Avoiding False Breakouts
Narrow breadth during a price breakout is a red flag.
“Narrow breadth during a price breakout is a red flag.”
If only a few stocks are pushing higher while the rest of the market sits still or drops, professionals wait for broader confirmation before committing capital. That patience filters out a lot of low-quality setups that end up trapping less experienced traders. It's the same instinct behind good sector analysis, understanding What Sector Strength Really Means before assuming a breakout is the real thing. A breakout backed by strong breadth across multiple sectors is a very different trade than one riding on two or three stocks, even if the chart pattern looks identical.
Putting Market Breadth to Work
Reading about breadth is one thing. Building it into your process is what actually changes results. Here's where to start.
Monitor the Advance/Decline Line Daily
Start monitoring the advance/decline line every trading day, not just when the market feels shaky. Breadth is most useful as an early warning system, and early warnings only work if you're checking in consistently rather than after the fact.
Compare Breadth to Price Action
Compare breadth indicators to index price moves side by side. Are they telling the same story, or are they pulling apart? That comparison alone will keep you out of a lot of trades that look better on the surface than they actually are.
Practice Spotting Divergences
Practice identifying divergences before you act on trades. This takes repetition. Pull up historical charts, mark where breadth and price disagreed, and study what happened next. Over time, spotting these patterns becomes second nature instead of something you have to think through in real time.
The Bottom Line: Why Market Breadth Explained Matters for Traders
Market breadth explained in one sentence: it's the difference between knowing what the market did and understanding why it did it.
“Market breadth explained in one sentence: it's the difference between knowing what the market did and understanding why it did it.”
Index prices tell you the outcome. Breadth tells you the story underneath, whether a move has real conviction behind it or whether it's a handful of stocks propping up a headline number. Professional traders build breadth into their daily routine because it catches what price alone misses, and it does so early enough to actually act on.
None of this requires expensive tools or a research team. It requires consistency and a willingness to look past the index for a few minutes each day. That's the real edge breadth gives you, not a secret indicator, just a habit most traders never build.