
The Market Is Rising: 5 Signs a Market Rally Is Healthy
Every time the market grinds to a new high, the same question follows it. Is this rally real, or is it running on fumes? Knowing the signs a market rally is healthy has almost nothing to do with the headline number, and almost everything to do with what's happening underneath it.
Price tells you what happened. It never tells you why.
When the index closes higher, that's the entire story most traders get. What price shows you is simple: the index closed higher today. What price hides from you is everything that actually matters: whether 400 stocks pushed that move, or 8 mega-caps carried the weight on their own. A headline number can look identical in both cases. The market underneath it can be in two completely different conditions.
That's why professional traders don't stop at price. They look at the internals: breadth, sector participation, new highs versus new lows, and volume. Those four things reveal who's really buying, and whether the move can hold.
5 Signs a Market Rally Is Healthy (Before You Trust It)
Before committing capital to a rising market, run it through these five questions. Are most stocks participating, or just a handful? Is strength broad across sectors, or concentrated in one or two? Are more stocks breaking out to new highs, or quietly breaking down to new lows? Is volume flowing into the stocks that are advancing, or into the ones that are declining? And is price making new highs while the internals underneath it are quietly weakening?
Here's how to check each one.
1. Breadth (Advance/Decline Line)
The advance/decline line tracks how many stocks are rising versus falling, independent of index weighting. It doesn't care how big Apple or Nvidia is. It just counts participants.
A healthy rally has broad participation. The advance/decline line should confirm the index, making new highs alongside it. When the two move together, that's real demand.
The warning sign is a divergence: the index sitting at new highs while the advance/decline line stalls or starts to roll over. That's a market where fewer and fewer stocks are doing the lifting, even as the headline number keeps climbing.
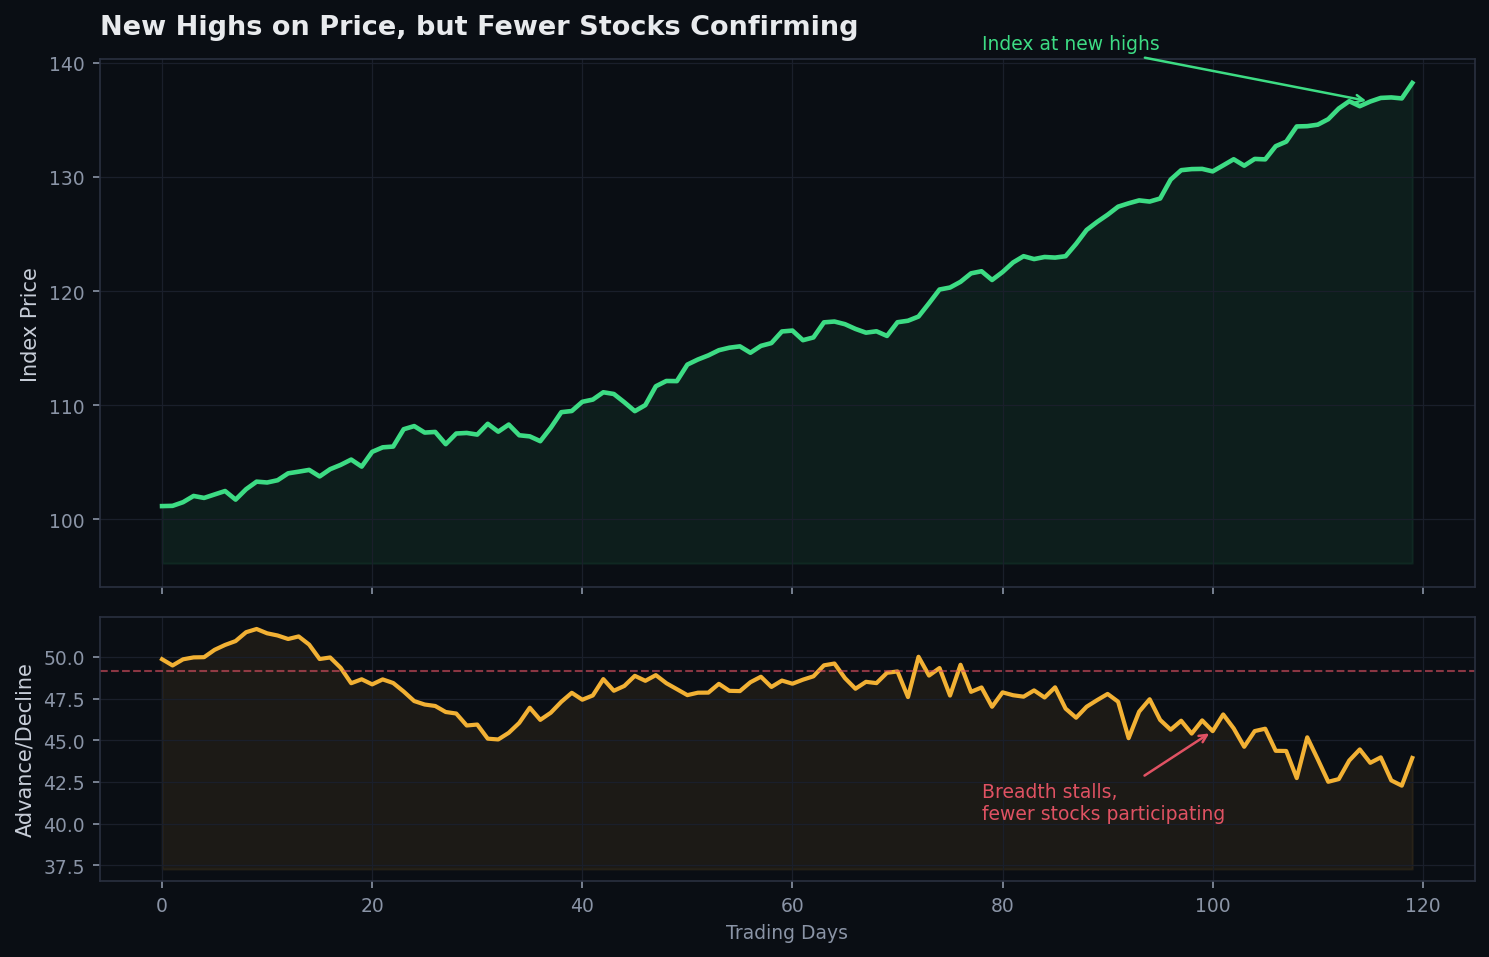
When price makes new highs but the advance/decline line stalls, fewer stocks are confirming the move.
2. Sector Participation
Next, check how many of the market's sectors are actually trending with the index, versus lagging behind it. Broad-based strength across cyclicals, tech, and financials signals real, widespread demand. That kind of rally has multiple legs to stand on.
The warning sign shows up when a rally that looks broad on paper is really one or two sectors doing the heavy lifting, especially if defensive sectors like utilities or staples are the ones leading. Defensive leadership during an "up" market is often a signal that capital is playing it safe, not chasing growth. If you want a deeper look at how to separate genuine sector strength from a narrow, top-heavy move, our breakdown of what sector strength really means walks through the process step by step.
3. New Highs vs. New Lows
This one gets overlooked constantly. Track the number of individual stocks hitting 52-week highs versus 52-week lows every single day, not just what the index itself is doing.
A strong market keeps expanding its new highs while its new lows shrink toward zero. That's expansion.
The warning sign is quiet: new lows creep higher even as the index grinds up. On the surface, everything looks fine. Underneath, a growing number of stocks are breaking down while the average investor is only watching the headline. That's quiet distribution, and it tends to show up well before price confirms anything is wrong.
4. Up-Volume vs. Down-Volume
Finally, compare the volume flowing into advancing stocks against the volume flowing into declining stocks. Rallies built on rising up-volume reflect real accumulation, institutions and funds putting capital to work, not just prices drifting higher on thin trading.
The warning sign is when price keeps rising on shrinking volume, or when down-volume days start outnumbering up-volume days even as the index grinds to new highs. That combination usually means the buyers who started the move are stepping back, and the people still pushing the index higher are running out of firepower.
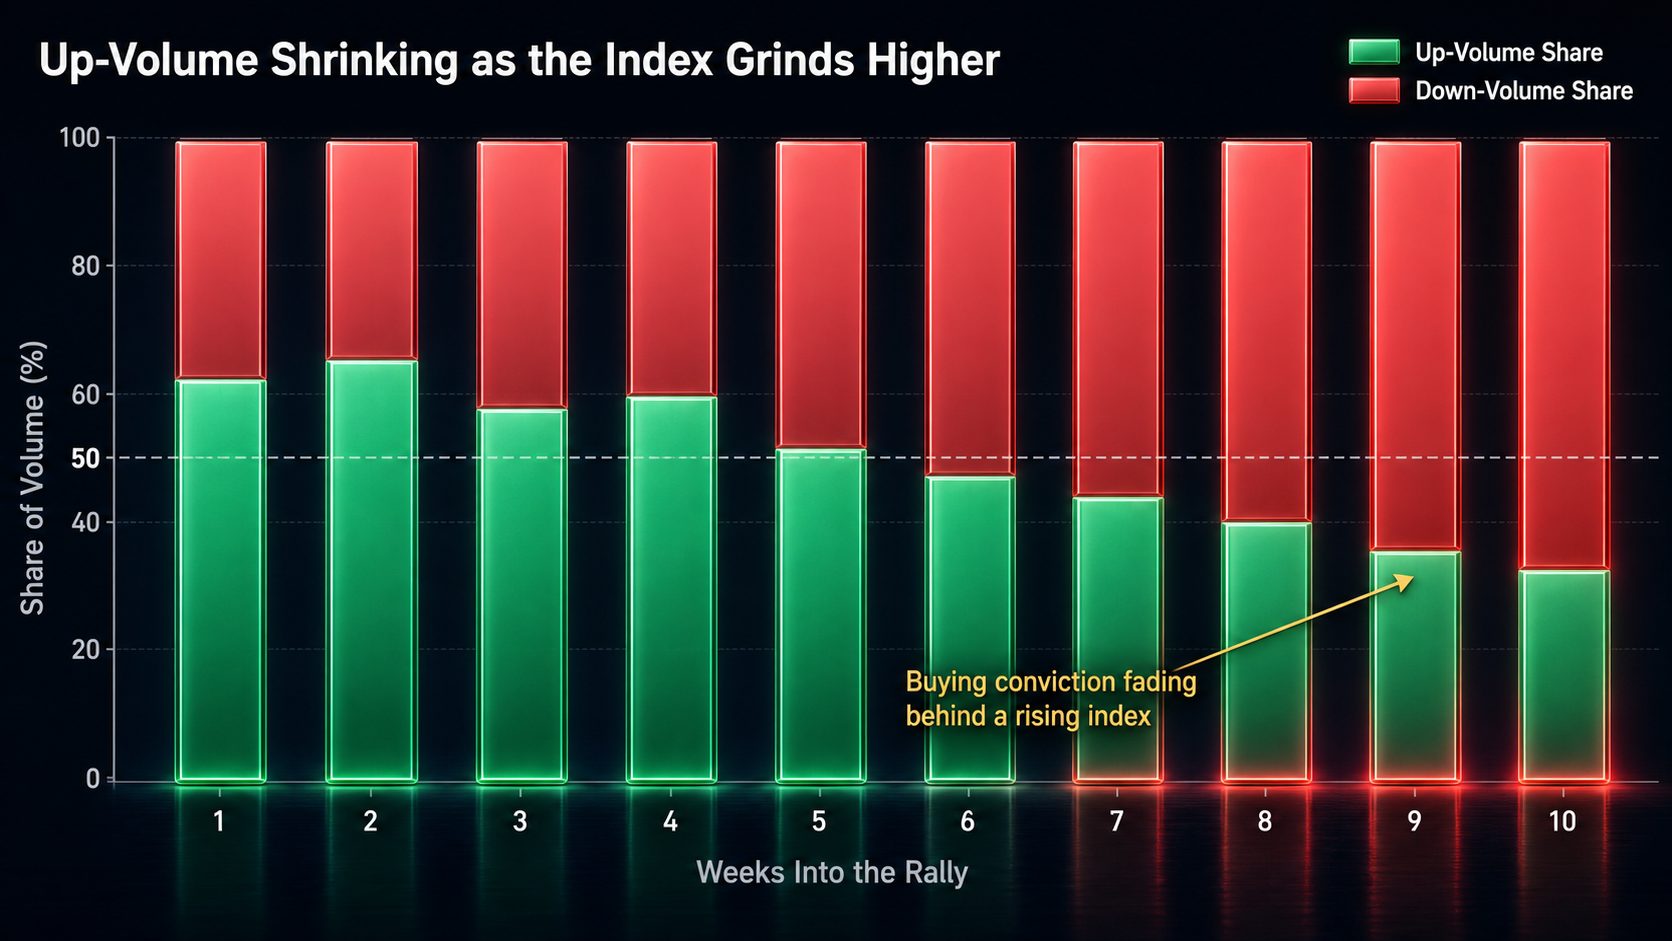
As up-volume share shrinks week over week, the rally is being carried by fewer active buyers.
Putting It Together: Confirm, or Don't Chase
Once you've checked all four internals, the read becomes straightforward.
**Internals confirm price when:**breadth is expanding, multiple sectors are participating, new highs are outpacing new lows, and up-volume is leading down-volume. That's a rally worth trusting.
**Internals contradict price when:**breadth is flat or declining while the index rises, the rally is concentrated in a handful of sectors, new lows are creeping up alongside new highs, and volume is drying up on the way higher. That's a rally to treat with caution, regardless of what the headline number says.
This is exactly the kind of setup we broke down recently when tech kept pushing the index higher while the rest of the market quietly lagged behind. If you want to see this pattern play out in real conditions, take a look at our recent piece on a narrowing rally, where breadth told a very different story than price did.
Why the Internals Matter More Than the Headline
Here's the part that trips up a lot of retail traders: none of these warning signs show up as a crash. They show up as a slow, quiet unwind that price doesn't confirm until much later. By the time the index itself rolls over, the internals have usually been flashing warnings for weeks.
That's the trap of trading price alone. It's a lagging read on a market that's already telling you something different underneath. Learning to spot these fake outs before price confirms them is one of the more valuable skills a trader can build, and it's worth studying in more depth if it's new to you. We've laid out several of the most common ones in 5 hidden trading patterns that expose market fake outs.
The good news is that none of this requires expensive tools or a data terminal. Breadth readings, sector performance, new high and new low counts, and up/down volume are all available through free screening platforms. What separates traders who catch the turn early from traders who get caught by it isn't access to better data. It's the habit of actually checking it, every week, whether the market feels calm or not. A five-point checklist only works if you run it consistently, not just when something already feels off.
None of this means you ignore a rising market. It means you don't take it at face value. Run the checklist. Trust the internals, not just the headline. Breadth, sectors, new highs and lows, and volume move first. Price catches up.
Traders who are serious about making this a career explore what it looks like to trade with firm backing.