
September Rate Cut Odds: How Traders Are Positioning Ahead of Jackson Hole
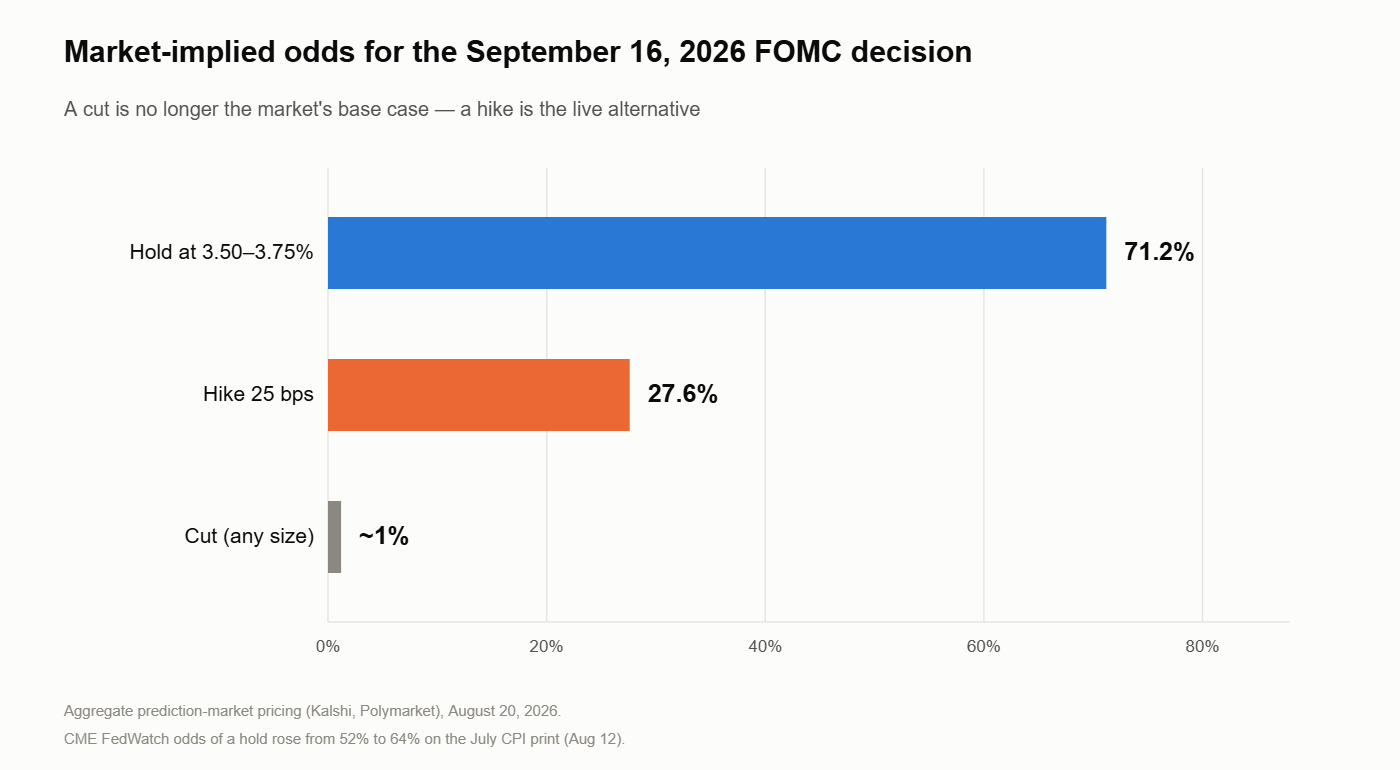
Six months ago, September rate cut odds were the consensus trade. Today they are close to a rounding error. Heading into this week, prediction markets priced roughly a 71% chance the Federal Reserve simply holds at 3.50%–3.75% on September 16, about a 28% chance of a quarter-point hike, and less than 5% spread across every cut scenario combined. The question traders spent the first half of 2026 positioning for has not just been answered. It has been inverted.
"The question traders spent the first half of 2026 positioning for has not just been answered. It has been inverted."
That is the backdrop for the Jackson Hole Economic Policy Symposium, running August 27–29 at Jackson Lake Lodge in Wyoming. In a normal year, Jackson Hole is a well-attended academic conference that occasionally produces a headline. This year it is the only scheduled opportunity anyone has to hear from the Federal Reserve before a decision that markets are no longer confident they can handicap.
Why Jackson Hole Carries Extra Weight This August
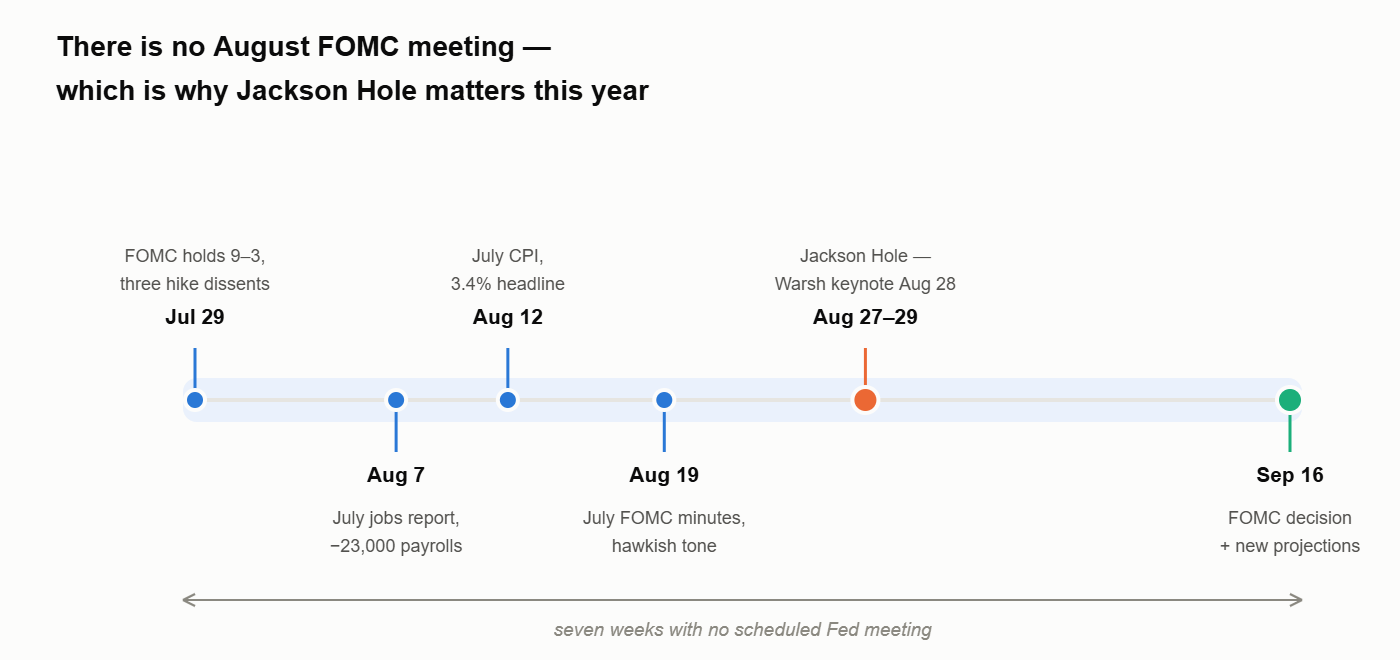
There is no August FOMC meeting. There never is — the 2026 calendar runs July 28–29, then jumps straight to September 15–16. That leaves a seven-week gap between the last policy statement and the next one, and this year that gap happens to contain a jobs report, a CPI print, a set of minutes, and a change in leadership at the top of the institution.
Kevin Warsh will deliver his first Jackson Hole keynote as Fed chair on the morning of Friday, August 28 — nineteen days before the September decision, and the last substantive communication before the pre-meeting blackout period closes the window entirely.
The symposium's official theme is "Financial Innovation: Implications for Payments and Policy," and roughly 120 central bankers and economists from more than 70 countries will spend three days discussing it. Almost none of that will be traded. What will be traded is whatever Warsh says, or pointedly does not say, about whether the tightening debate inside the committee is live.
How September Rate Cut Odds Collapsed
The repricing happened in three steps, and the sequence matters more than any single data point.
July 28–29: A Fractured Hold
July 28–29: The committee voted 9–3 to hold. Notably, all three dissents favored a hike — the first time since September 2016 that three policymakers aligned on a single directional dissent. A hold that looks unanimous in the headline was, in the vote tally, the most fractured Fed in a decade.
Early August: A Brief Return of the Cut Narrative
Early August: The July employment report landed badly. Nonfarm payrolls fell by 23,000 against expectations of roughly +83,000, and May and June were revised down by a combined 103,000. For about seventy-two hours, the cut narrative came back to life.
August 12: The CPI Print That Shifted the Odds
August 12: July CPI came in at +0.1% month over month and 3.4% year over year, with core at +0.2% and 2.5%. Softer than feared — but "softer than feared" at 3.4% headline is not a number that forces anyone's hand. CME FedWatch showed the probability of a September hold rise from 52% to 64% on the print, with the residual probability sitting in the hike column rather than the cut column.
August 19: The Minutes Confirm Hawkish Sentiment
August 19: The July minutes were released. Many participants assessed that higher rates would likely be necessary if inflation did not fall. Some argued financial conditions might not be restrictive enough to return inflation to 2%. The minutes were three weeks stale by the time they hit, but they confirmed that hawkish sentiment extended well beyond the three visible dissenters.
The Data Is Pulling in Two Directions
The reason no one can confidently price September is that the two halves of the Fed's mandate are currently telling opposite stories.
The labor market is deteriorating in a way that historically precedes easing. A negative payroll print with triple-digit downward revisions is not a soft patch; it is the shape of a turn. Under a normal reaction function, that data alone gets a cut on the table.
Inflation is not cooperating. Headline CPI in the mid-3s, energy down 1.5% on the month but still 14.7% higher year over year, and crude above $80 leaves the committee with an uncomfortable set of choices. A Fed that cuts into a re-accelerating energy complex risks undoing two years of work. A Fed that hikes into a contracting labor market risks the recession it has spent those two years trying to avoid.
There is no split-the-difference option that satisfies both. Which is precisely why one speech, on one Friday morning, has this much leverage.
What Positioning Actually Looks Like Right Now
The most useful signal is not the headline probability. It is where the different markets disagree with each other.
The two-year Treasury is yielding roughly 4.13% against a fed funds midpoint of about 3.63%. The front end of the curve is not priced for cuts. It is priced with a cushion for the possibility that the next move is up.
Equities are positioned as though none of that is a problem. The S&P 500 is at record highs near 7,799, up about 14% on the year, trading at a forward multiple around 19.6 on expectations of 29% earnings growth for 2026. The VIX has been sitting near 14.5 — close to its lowest levels of the year.
That is the setup worth understanding: the rates market is hedged for hawkishness, and the equity market is not. When two markets price the same event differently, the cheaper-hedged one is where the violence tends to show up.
"When two markets price the same event differently, the cheaper-hedged one is where the violence tends to show up."
The Four Things Traders Are Listening For at Jackson Hole
Most of Warsh's speech will be about payments infrastructure. The tradable content will be narrower than that:
- Whether the hiking cycle is described as paused or finished. These are different words with very different September implications.
- Conditional language on inflation. "If inflation does not fall" is a threat. "As inflation continues to moderate" is a green light.
- How he characterizes the labor data. Treating the payroll drop as noise is hawkish. Treating it as a signal is not.
- Anything on the framework itself, including the minutes' discussion of moving to six scheduled meetings a year. Structural changes to how often the Fed can act change the value of every rate option on the board.
How Professionals Position Into an Event Like This
The honest answer is that they mostly do not try to predict it. They size for it.
A binary, headline-driven event with a known timestamp is one of the few situations where risk management is almost entirely a pre-trade decision. Position size gets set before the speech, not after. The invalidation level is defined in advance, in writing, at a price — not discovered in real time while a chart is moving. Exposure that depends on a specific outcome gets reduced to the level where being wrong is survivable and boring.
This is the part that separates a professional operation from a retail one, and it is the same discipline that shows up in how firms manage risk at scale. A firm does not ask what the Fed chair will say. It asks what happens to the book under each version of what he might say, and refuses to carry the version it cannot absorb.
There is also a practical wrinkle worth flagging: the keynote lands Friday morning. Anything held through it is held into a weekend, where gap risk is real and there is no way to manage a position for sixty-five hours.
The Complacency Trap in a Low-Volatility Tape
A VIX near 14 does two things at once. It makes protection cheap, which is genuinely useful. It also makes traders careless, which is not.
Sustained low volatility quietly recalibrates what feels normal. Position sizes drift up. Stops get given more room. A tape that has not punished anyone in weeks starts to feel like a tape that will not. That drift is rarely a decision; it is an accumulation of small ones, which is what makes emotional control in trading a mechanical problem rather than a personality one.
The traders who get hurt at events like Jackson Hole are usually not the ones who read the Fed wrong. They are the ones who were carrying more than they realized because nothing had gone wrong in a while.
"They are the ones who were carrying more than they realized because nothing had gone wrong in a while."
What to Do Between Now and September 16
Write down, before August 28, what you think each scenario is worth to your positions. Decide what size you are willing to hold through a Friday-morning headline. Assume you will be wrong about the content of the speech and correct only about your own risk.
September rate cut odds may well move again — a hot CPI or another negative payroll print between now and the meeting would reprice this whole board a third time. The traders who come out of that intact will be the ones whose process did not depend on getting the call right.
That gap — between predicting markets and managing them — is the difference between trading as a hobby and trading as a profession. If you want to see what a real trading career looks like, that is where the conversation starts.