
Signs of Market Weakness: What Breaks Down Before the Big Move
Market tops rarely announce themselves. By the time a headline confirms a downturn, the move is already well underway. But if you know where to look, the signs of market weakness in stocks tend to show up in the internals long before price ever confirms them. Breadth, sector leadership, and volume all tend to crack first. Price is usually the last piece of the puzzle to catch up.
Signs of Market Weakness: Price Is the Last to Know
An index is just an average of hundreds of stocks. The S&P 500 alone is built from 500 individual names, and that headline number can keep drifting higher even while a growing number of the stocks underneath it have already started to slip. That gap between a rising index and weakening internals is the first clue that something is off.
This is why professional traders don't stop at the index level. They watch what's called market breadth, which is really just relative strength and relative weakness showing up across sectors and individual stocks before the index itself reacts. Strength creeps into sectors first as money flows in. Weakness creeps into sectors first as money flows out. The index is simply confirming what the crowd already decided.
Sign 1: Breadth Quietly Deteriorates
A healthy bull market is a broad one. A lot of sectors and a lot of stocks are rallying together, which is what pulls the whole index higher. That's not always what's actually happening underneath the surface, though.
The advance/decline line is one of the simplest ways to check. It measures how many stocks are moving together on any given day. In a healthy advance, the gains are broad and the line keeps climbing right alongside the index. When a top starts to form, fewer and fewer stocks join the rally even as the index keeps printing new highs. Watch for the advance/decline line to flatten out or roll over while the index is still climbing. That tells you fewer stocks are actually participating in the move, and a smaller group of names is doing all the work.
New 52-week highs versus new 52-week lows is another one worth tracking daily. When very few stocks continue making fresh highs even as the index grinds higher, leadership is thinning out fast.
The percentage of stocks trading above their 50-day moving average is a big one too. In a strong market, a large share of stocks hold above that level. When that number starts slipping, even while the index looks fine on the surface, it's an early signal that the rally's foundation is getting shakier than it looks.
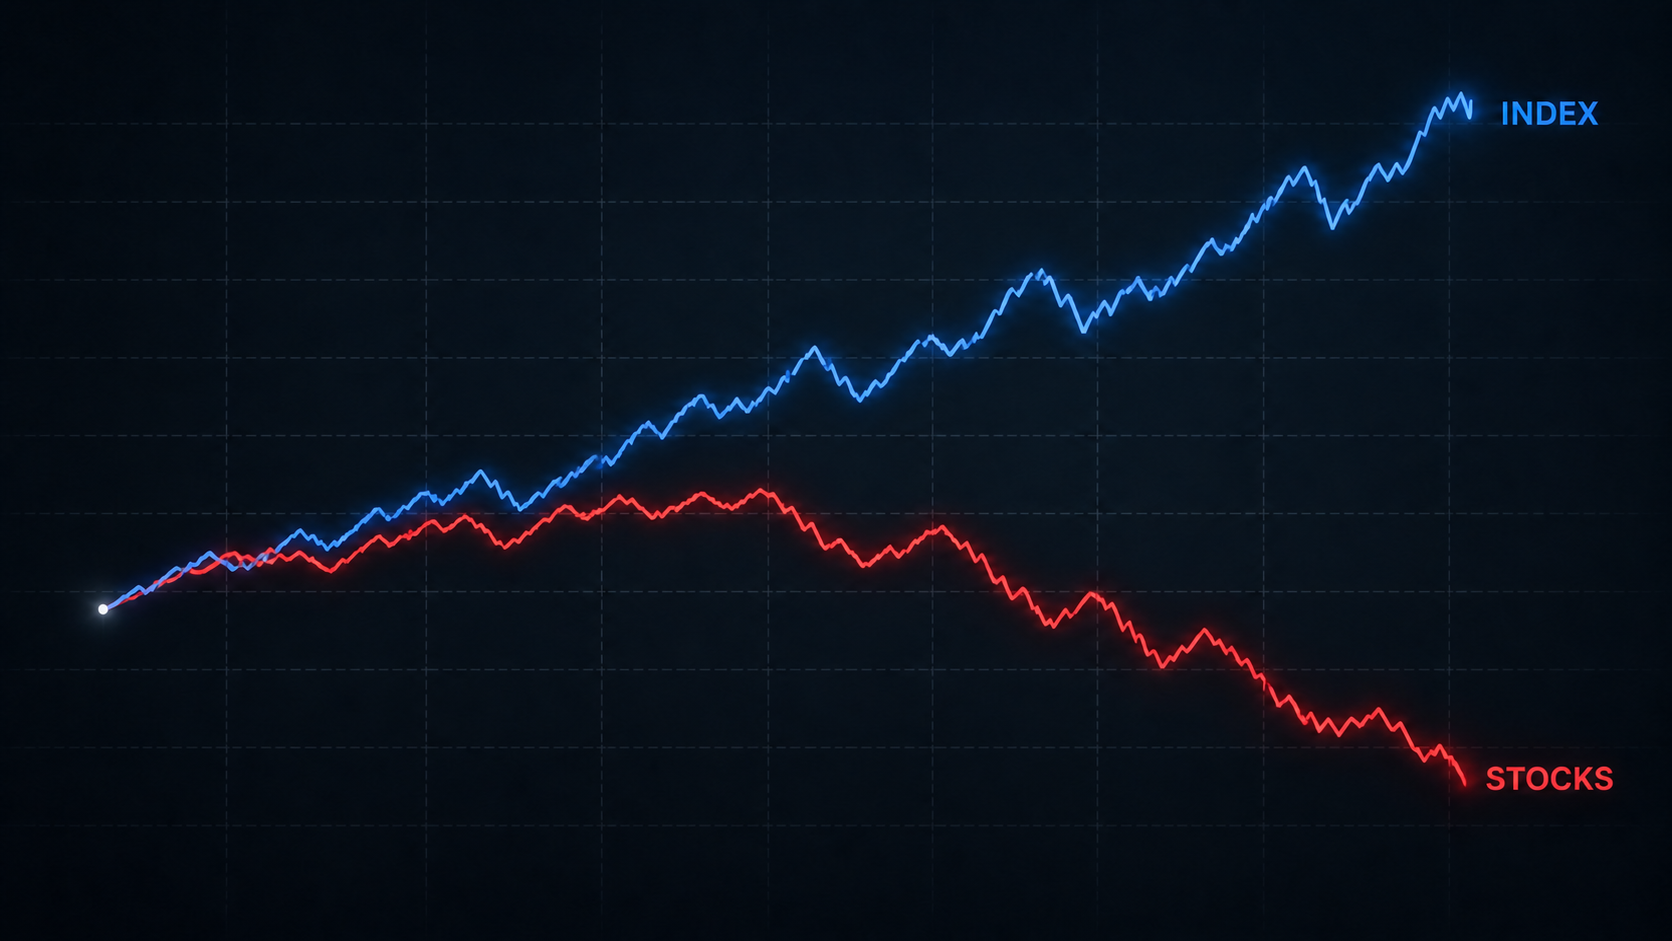
As leadership narrows, fewer stocks confirm the index's advance, a classic early warning sign.
Sign 2: Sector Participation Narrows
A strong market is a team effort, with many sectors pulling in the same direction at the same time. When leadership shrinks down to one or two groups and money starts rotating toward defensive corners, the rally is running on fumes.
Watch for leadership narrowing from growth-oriented sectors like tech, financials, consumer discretionary, and industrials into defensive sectors like utilities, healthcare, consumer staples, bonds, and real estate. That kind of rotation is one of the clearer tells that a rally has become dependent on a shrinking handful of names to carry the whole index.
It's also worth watching the stocks that have been leading the market. When former leaders stop making new highs and start breaking down technically, that's often one of the more reliable signs of market weakness in stocks that traders can act on before price confirms anything. Getting a handle on how to read strength and leadership in the first place makes it a lot easier to spot when that leadership starts to fade. If you want to go deeper on that side of the equation, our guide on how to read market strength walks through what healthy participation actually looks like.
Sign 3: Volume Tells the Truth
Volume shows conviction, or the lack of it. When down days come on heavy volume and rallies happen on light volume, that's often a sign that big institutions and money managers are quietly selling into strength rather than chasing it.
In a healthy market, volume on down days tends to run smaller than volume on up days. Watch for that relationship to start flipping. Heavy selling on down days, or distribution days, paired with weak, low-volume bounces that fade quickly, is a warning sign. So is big volume that produces very little actual price progress, sometimes called churning. When you start seeing selling volume build while buying volume shrinks, that's the market internals telling you something price hasn't confirmed yet.
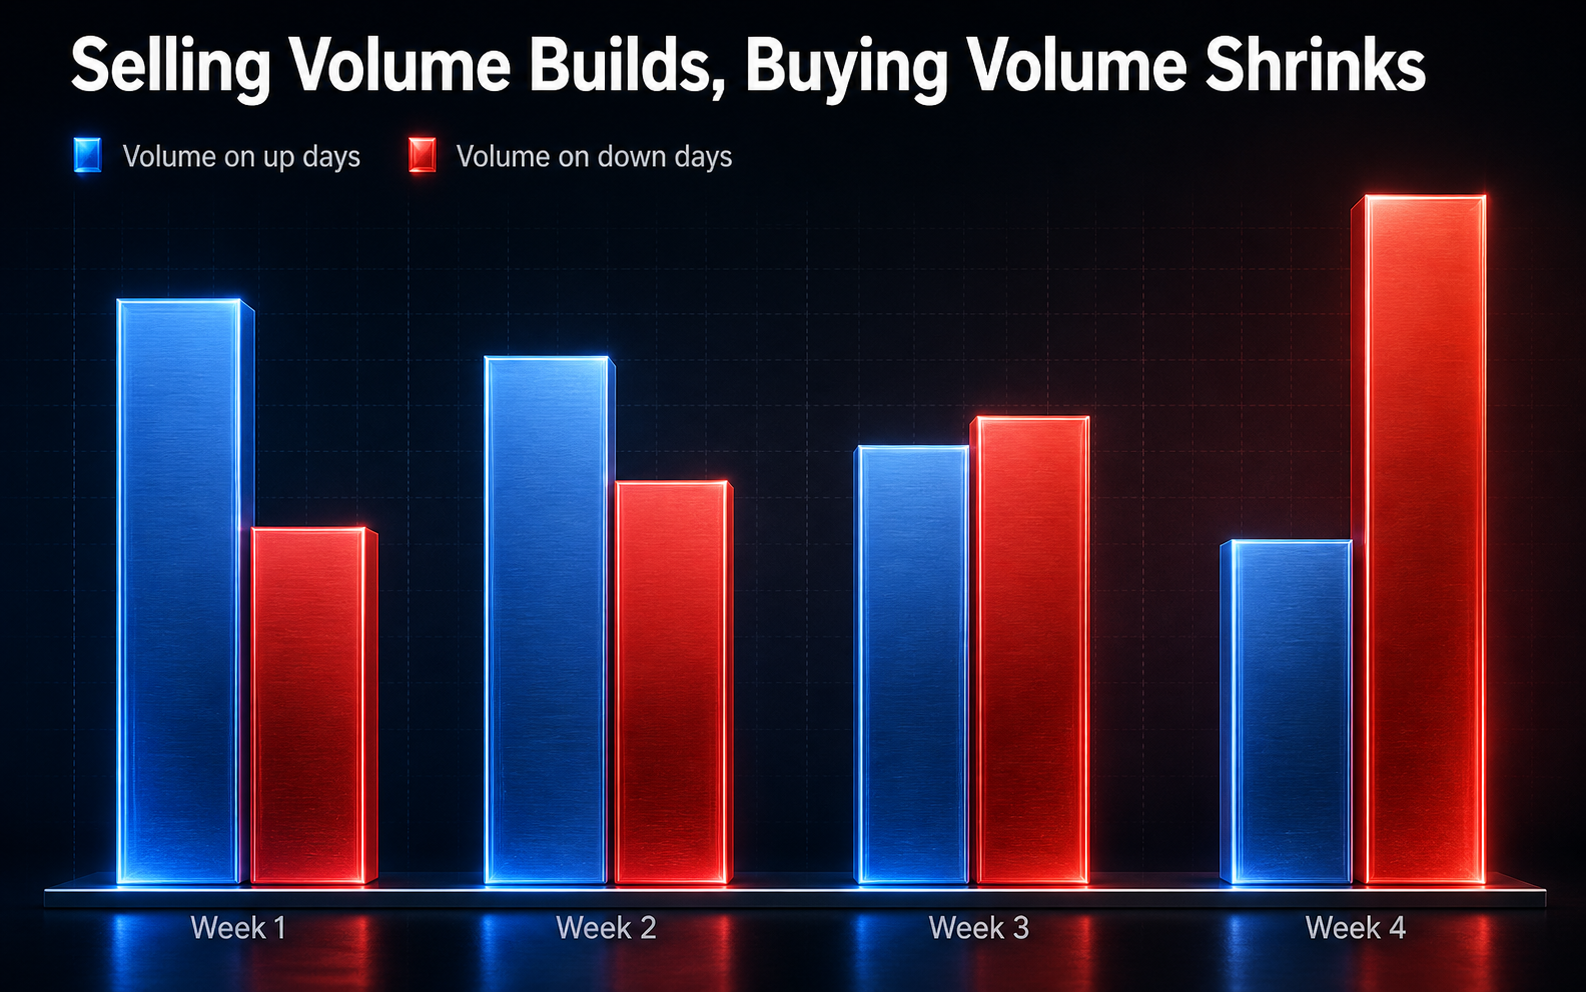
Heavier volume on down days paired with lighter volume on up days often shows up before price rolls over.
How It Stacks Up
These signals rarely all arrive at once. They tend to stack in a sequence, and the more boxes that check, the higher the odds that price eventually follows:
**1. Breadth fades.**Fewer stocks join the move higher.
**2. Sectors narrow.**Leadership shrinks and money goes defensive.
**3. Volume shifts.**Selling gets heavy, rallies get quiet.
**4. Price confirms.**The index finally breaks support.
Watching for that sequence, rather than any single signal in isolation, is what separates traders reacting off one data point from traders who actually understand what the market is telling them.
What Professional Traders Do About It
Weakness signals are not a reason to panic-sell. They're a reason to get defensive and disciplined.
**Tighten risk.**Shrink your position size, adjust your stops, and take partial profits into strength rather than chasing and adding to bullish positions. This is also a good time to revisit how you're sizing positions in the first place. Our breakdown on capital allocation covers how to think about position sizing so you're not caught overexposed right as conditions start to shift.
**Respect the signals.**Treat stacked warnings as a green light to protect capital, not to add aggressively. Permabulls tend to assume the market only goes up, and over the long run, indexes are in fact designed to trend higher because weak companies eventually get removed and replaced with stronger ones. But individual stocks and individual positions don't get that luxury, and treating every pullback the same way regardless of what the internals are telling you is how account drawdowns happen.
**Stay patient.**Cash is a position. When you're getting conflicting signals or you don't fully understand what the market is telling you yet, waiting for the next clean setup beats forcing a trade. Sometimes no position is the best position.
This kind of disciplined, defensive posture is exactly how professional traders are trained to manage risk in the first place, well before conditions ever get uncertain. For a closer look at that process, check out our article on how professional traders manage risk.
The Bottom Line
The index is always the last domino to fall. Breadth fades first. Sector leadership narrows next. Volume shifts from confirming rallies to confirming selloffs. Only then does price actually break down and confirm what the internals have been signaling for weeks. Learning to read those early warnings, rather than waiting for the headline number to catch up, is what gives traders room to get defensive before a move down instead of after.
Traders who are serious about making this a career explore what it looks like to trade with firm backing.